Solved: RES7002 Research Methods-Data Analysis and Interpretation
RES7002
Research Methods
Data Analysis and Interpretation
Date for Submission: Please refer to the timetable on ilearn
(The submission portal on ilearn will close at 14:00 UK time on the date of submission)
Assignment Brief
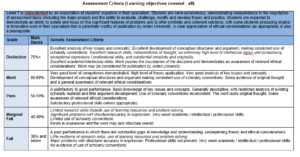
As part of the formal assessment for the programme, you are required to submit a RES7002 assignment. Please refer to your Student Handbook for full details of the programme assessment scheme and general information on preparing and submitting assignments. Learning Outcomes: After completing the module, you should be able to:- Identify, research, critically summarise and apply key concepts in psychology to a range of psychological issues
- Critically evaluate and apply different methodological approaches to the study of mental life and behaviour
- Conduct an independent research project at a postgraduate level with a reflective understanding of ethical issues in human participation in research
- Critically distinguish between different research approaches in psychology and their application, based on relevant theoretical, philosophical, practical, statistical, and methodological reasoning
- Demonstrate competence in the planning and execution of research to a professional and ethical standard, act autonomously, and demonstrate originality
- Undertake effective communication and presentation skills to support or strengthen arguments and analysis
- Professional Skills: Utilising the skills to perform effectively within the professional environment. Work within a team, demonstrating interpersonal skills such as effective listening, negotiating, persuading and presentation. Be flexible and adaptable to changes within the professional
Assignment Task
There are six data sets below (each is on a new page), please analyse all six data sets. The data sets are worth equal marks.Data Set 1 (500 words or equivalent) – Non-parametric test
Below is an outline of an experiment. Please analyse the data using an appropriate non-parametric test and write up a Results section only, plus a final statement putting the results into words (which is usually the first line of the Discussion section). Colours are often associated with emotions, and are commonly used in films to indicate good or bad characters. The researchers were interested in whether people would perceive sports teams wearing a black jersey as more aggressive than sports teams wearing a blue jersey. Fifty participants who were naïve to American Football teams were randomly allocated to rate a series of predominantly black or blue jerseys. Participants looked at a set of five jerseys and provided an ordinal scale ranging from 1 (timid) to 10 (aggressive). The median rating across the five jerseys was recorded for each participant, and is presented in Table 1. The hypothesis was black jerseys would be rated as more aggressive as blue jerseys.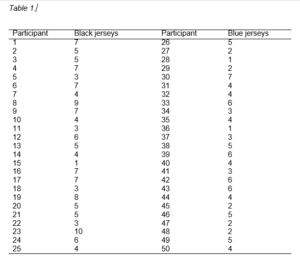
Data Set 2 (500 words or equivalent) – t-Test
Below is an outline of an experiment. Please analyse the data using an appropriate t-test and write up a Results section only, plus a final statement putting the results into words (which is usually the first line of the Discussion section). The experiment was set up to test the hypothesis that daily jogging reduces the incidence of panic attacks in 30-40-year-olds diagnosed with a panic disorder. Participants, who were not regular joggers, registered with a jogging group for three months. In the first few weeks, they jogged twice a week for 20 minutes each time, then gradually built up the programme to running 40 minutes daily. In the three months prior to starting the programme, participants monitored and recorded the incidence of panic attacks. They continued doing so during the three months of the programme. The experimenters counted the number of panic attacks for each participant before the jogging programme and during it. On average participants had around 53 panic attacks in a three-month period. The data are shown in Table 2, and divided into before and during the jogging programme. The hypothesis was jogging would decrease the number of panic attacks in comparison to before starting to jog.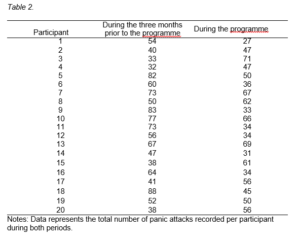
Data Set 3 (500 words or equivalent) – Chi-square Test
Below is an outline of an experiment. Please analyse the data using an appropriate chi-square test and write up a Results section only, plus a final statement putting the results into words (which is usually the first line of the Discussion section). This study is about the effects of messages to reduce litter. The researchers handed out 2,000 leaflets at a local store to advertise a number of special offers on selected products. Half of the leaflets contained the message “Please do not litter, dispose of properly” and the other half (control) had no such message. At the end of the day, when the store was closed the researchers collected the leaflets left in bins and left on the floor. The rest of the leaflets were assumed to have been taken home (and not included in the analysis and it could not be determined whether they were binned or discarded). The raw data are shown in Table 3. The hypothesis was messages encouraging people to throw their rubbish in the bin would be more likely to be found in the bin.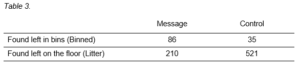
Data Set 4 (500 words or equivalent) – ANOVA Test
Below is an outline of an experiment. Please analyse the data using an appropriate ANOVA test and write up a Results section only, plus a final statement putting the results into words (which is usually the first line of the Discussion section). Sixty participants who attended a National Driver Alertness Course were randomly divided into three groups, with each group being exposed to different training methods. Training is designed to teach drivers how to lower the risk of having an accident and to teach drivers how to identify the speed limits on different types of roads. The first group undertook a training programme that was enhanced with graphic images of the dangers of speeding with real video footage of car accidents. The second training programme was enhanced with textual descriptions of car accidents, while the third training programme (normal training group) was not enhanced with either video or textual descriptions of car accidents. After the training, drivers had black boxes fitted to their cars and their speed and location were recorded for three months. Data was abstracted for locations where the speed limit was 50 km/h (kilometres per hour). The average speed was computed for each driver in these locations and are shown in Table 4. The hypotheses were training with graphic enhancement would lead to lower average speed than training with textual enhancement, which would have a lower average speed than normal training.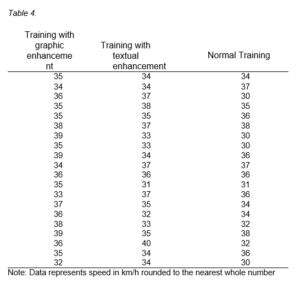
Data Set 5 (500 words or equivalent) – Correlation Test
Below is an outline of study on intelligence. Please analyse the data using an appropriate correlation test and write up a Results section only, plus a final statement putting the results into words (which is usually the first line of the Discussion section). Twenty-eight children were rated on numerical intelligence by both their teachers and their primary care giver. The data are shown in Table 5. The prediction was that the two ratings would have a positive relationship.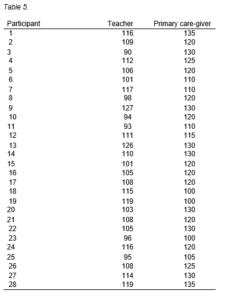
Data Set 6 (500 words or equivalent) – ANOVA test
Below is an outline of study on impulsivity and task difficulty. Please analyse the data using an appropriate ANOVA test and write up a Results section only, plus a final statement putting the results into words (which is usually the first line of the Discussion section). Forty-six adults completed a measure of impulsivity, and were divided into two groups: high and low impulsivity. The participants then completed a measure of response inhibition on a computer known as the Eriksen Flanker task. This presents the participants with an arrow which is surrounded by two arrows on each side (e.g. <<<<<). The participant must press a button on the keyboard to indicate whether the arrow is facing left or right. There are congruent and incongruent trials. The congruent trials are when the outer arrows are facing the same way as the central arrow (<<<<<). The incongruent trials are when the outer arrows are facing the opposite way to the central arrow (<<><<). The researcher measured the mean response time (ms) to indicate whether the arrow was facing left or right for the congruent and incongruent conditions. The data are shown in Table 6 on the next page. The researcher hypothesised that participants high in impulsivity would have faster response times than participants low in impulsivity. In addition, incongruent trials were expected to have slower response times than congruent trials. There was no hypothesis for whether response times would be affected by the interaction between impulsivity group and congruency.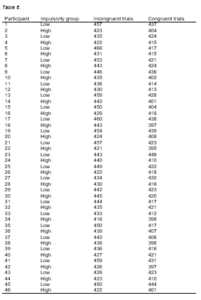
Formative Feedback
You have the opportunity to submit a draft of your work to receive formative feedback. The draft should contain no more than the answers to two data sets. This form of feedback is designed to help you develop areas of your work and it helps you develop your skills as an independent learner. Your work must be submitted via email on or before two weeks prior to the assessment submission date. This is to allow time for you to reflect on the feedback and draft your final submission. Formative feedback will not be given to work submitted after the above date.Guidelines:
You may underpin your analysis with appropriate academic research and if you do you must ensure this is referenced using the APA referencing format. The My Study Skills Area contains the following useful resources:You must use the APA Referencing method in your assignment.
Additional notes: Students are required to indicate the exact word count on the title page of the assessment. The word count excludes the title page, tables, figures, diagrams, footnotes, reference list and appendices. Where assessment questions have been reprinted from the assessment brief these will also be excluded from the word count. ALL other printed words ARE included in the word count See ‘Word Count Policy’ on the homepage of this module for more information.Assignments submitted late will not be accepted and will be marked as a 0% fail.
Your assessment should be submitted as a single Word (MS Word) or PDF file. For more information please see the “Guide to Submitting an Assignment” document available on the module page on iLearn. You must ensure that the submitted assignment is all your own work and that all sources used are correctly attributed. Penalties apply to assignments which show evidence of academic unfair practice. (See the Student Handbook which is on the homepage of your module and also in the Induction Area).