Assignment 2: Canadian Imports in HS6110
This assignment is designed to illustrate how to do the course project based on an industry, using Canadian Imports in HS6110 as an example. Please keep in mind that you are graded according to:
- How well can you follow the instructions? How well can you analyze the data?
- How well can you raise potential research questions?
- How well can you draw your conclusions?
Please note those who have not been a major contributor to Assignment 1 must be a major contributor to this assignment. For those who are a major contributor to both assignments, the higher one will be counted as the individual assignment grade.
Data Collection. - Trade data in HS6110.
a. Dataset A. Go to https://comtrade.un.org/data/ and make the following
choices: 1 type of product “goods”; 3 selected desired data- period “2016”,
reporters “Canada”, partners “All”, trade flows “Import”, HS commodity codes “6110”; and 4 See the results “Download CSV”.
b. Dataset B. Change the choices: 3 selected desired data- period “2016”, reporters “All”, partners “world”, trade flows “Export”. Choose to Download the data. - Information on Canadian Import Tariff. https://www.cbsa-asfc.gc.ca/tradecommerce/tariff-tarif/2016/html/00/ch61-eng.html . Please note that you need to look into https://www.cbsa-asfc.gc.ca/trade-commerce/tariff-tarif/2016/html/countriespays-eng.html to find corresponding codes for applicable tariff treatments.
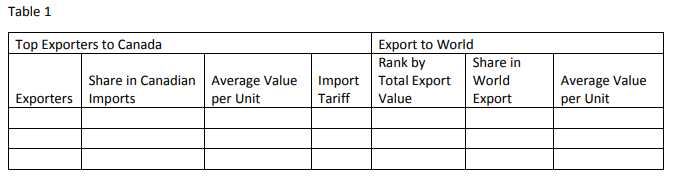
Data illustration: - Complete the following Table 1. (This table is the start point for the rest part of the assignment. I expect more than one person to be the major contributor to this table.)
Please note that the table should have more than 3 rows. In addition, please note not all information is available for every exporter, so you may have some cells left empty.
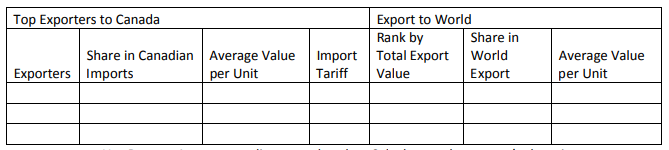
a. Use Dataset A, sort according to trade value. Calculate each exporter’s share in Canadian import by share = trade value by exporter / total import value from world. List in the first column of Table 1 the countries whose export share is no lower than 1% and copy their share to the second column.
b. Add up all other countries’ trade value, enter as “Others” in the last row of table 1.
c. Calculate average value per unit = trade value / trade quantity. Please use the “number of items” as quantity.
d. Find information on tariff rate faced by different exporters and enter it in the fourth column.
e. Use Dataset B. Sort all countries according to trade value. Find the rank of the top exporters to Canada (the countries you have listed in the first column) and enter it in the fifth column. **note, you will have to leave some cell empty.
f. Calculate the total world trade by summing all exporters’ trade value.
g. Complete the rest of the table as much as possible using Dataset B.
- Raise three research questions and use the information from Table 1 to answer them.
(Remember to keep your description brief and illustrate with better formatted charts and tables other than Table 1. Consider how you would approach the question as part of a poster.)
Example Question:
Who are the top exporters of HS6110 to Canada?
Is there any exporter that benefits from a preferential trade policy? - (Bonus point) Is it possible to fill in any of the empty cells you have in table 1? Describe one.
Question 1:
Answer (conclusions) to Question 1.
Question 2:
Answer (conclusions) to Question 2.
Question 3:
Answer (conclusions) to Question 3.