Critical Report Topic: Financial Analysis of an Electricity Company
Background
Energy is an essential part of the economic and social fabric of society. Energy consumption within a society is a function of population, climate, economic activity, the structure of the economy, and energy resource availability. Energy information and analyses provide vital inputs to public policy development and private investment prioritization in the energy market. New Zealand’s energy production is derived from both renewable and nonrenewable sources. Renewable energy sources are increasingly utilized by large electricity generators. Renewable energy’s share of total primary energy supply (TPES) have increased rapidly since 2008, driven largely by increased electricity generation from geothermal energy and reduced electricity generation from coal. The latest international comparison shows that New Zealand has the third highest contribution of renewable energy to TPES in OECD countries, behind Iceland and Norway.
Electricity generation in New Zealand
In New Zealand, electricity generated from renewable energy sources provides 80.8% share of all energy generated. In 2015, 42,876 GWh of electricity was generated in New Zealand, an increase of 1.6% from the previous year. This increase was led by geothermal, hydro and wind generation, reducing the need for generation from fossil fuels.
Hydroelectric generation has been a part of New Zealand’s energy system for over 100 years and continues to provide the majority of our electricity needs. Currently there are over 5,000 MW of installed hydro capacity, mainly in the South Island. Hydro production, however, relies on water inflows to hydro dams across the country.
Geothermal generation has been an integral part of New Zealand’s electricity landscape for a long time. It began over 55 years ago with the opening of the Wairakei power station in November 1958. Most of New Zealand’s installed capacity is situated in the Taupo Volcanic Zone.
Geothermal generation provides around 15% of New Zealand’s electricity generation. Wind generation has grown quickly as a source of electricity in New Zealand. The first wind farm, Hau Nui, was commissioned in 1997. Now wind generation makes up around 5% of New Zealand’s electricity generation. Most of New Zealand’s wind farms are located in the North Island, with the two largest farms in the lower North Island, Tararua Wind Farm and West Wind Makara.
Other renewable sources of electricity generation include bioenergy, solar energy and marine energy. Of these, bioenergy is the largest contributor to electricity generation in New Zealand. Bioenergy is predominantly from woody biomass consumed at a number of cogeneration plants located at wood processing factories and also from biogas produced from digesting waste at wastewater treatment plants and landfills.
Electricity generated from the combustion of coal, oil, and gas provide baseload and backup electricity supply. Generation from these fuels provides around a quarter of New Zealand’s electricity. Most of New Zealand’s thermal plants are found in the North Island, close to domestic coal, oil, and gas resources.
Electricity demand in New Zealand
Around a third of New Zealand’s electricity demand is from households, and over a third is from industrial sectors. The majority of industrial electricity demand is from wood, pulp, paper and printing, and the basic metals sectors; with the Tiwai Point aluminum smelter the largest consumer of electricity in New Zealand. The commercial sectors consume around a quarter of New Zealand’s electricity demand. The remaining demand comes from the transport, agriculture, forestry, and fishing sectors; which consume only a small amount. Electricity demand was down 1.9 percent in the March quarter of 2017 from the March quarter of 2016, driven by a 3.8 percent fall in industrial demand.
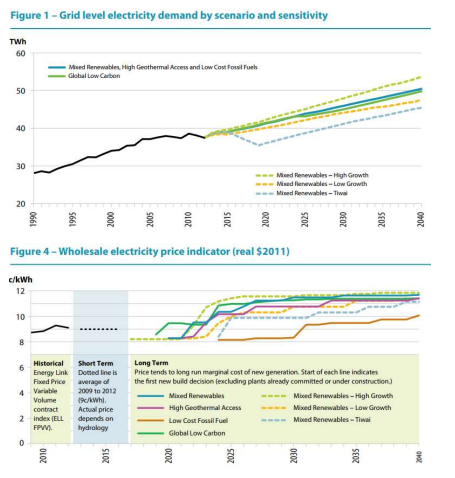
In a report recently released by the Ministry of Business, Innovation & Employment1, future demand and electricity price are predicted using scenario analysis. Figure 1 and Figure 4 extracted from the report show forecasts for the electricity demand and electricity prices. It is expected that a lower demand growth, combined with excess supply, would put a downward pressure on electricity prices for the next decade.
The largest four electricity generating companies, Meridian Energy (MEL), Contact Energy (CEN), Genesis Energy (GNE) and Mercury NZ (MCY, renamed from Mighty River Power), jointly provide more than 80% of New Zealand’s electricity generation. All big four companies have public-owned shares trading on the New Zealand Stock Exchange. Taking the perspective of a financial analyst, select one energy company (MEL, CEN, GNE or MCY) to conduct a thorough financial analysis. Make sure that each team member analyzes a different company, and share the numerical results with other team members for peer company comparisons.
Write an individual critical report no more than five pages long (excluding the title page), and submit your critical report together with your “Team member evaluation sheet” to designated assignment box outside QB2.37 before 10am on the 9th of October. Comment on the company’s financial performance, financial health, capital structure policy, and dividend policy.
Discuss the strengths, weaknesses, threats, and potential opportunities for the company.
Suggested tasks and questions for discussion (total of 30 points):
Collect four years’ data from the financial statements in the company’s annual reports posted on the course Stream site. Enter data into an Excel worksheet (feel free to use and modify the “Financial analysis template” contained in the Excel file named “Critical Report Template”).
For more information about the company, go to the homepage of Massey University, then “Library", "Subject Guides", "Accountancy", click on the database named "NZX Company Research” and then company code in the search box. You need have a valid Massey ID and password for gaining access to this paid database that Massey Library subscribes to.
Perform a common size and a percentage change analysis. Comment on the results.
Perform a ratio analysis and comment on the strength and weakness of the various ratios.
Calculate the company’s market-value based leverage ratios. Comment on the company’s capital structure policy.
Calculate the company’s dividend payout ratios over time. Comment on the company’s dividend policy.
Provide a summary discussion of the company's financial performance and financial health relative to its competitors. Discuss the strengths, weaknesses, opportunities and threats of the company under your analysis.
Instructions and Grading Guidelines for Critical Report
This is an individual assessment requiring some team work and sharing of quantitative analytical results.
Sign up to a team of four on Stream before 5pm on September 22.
Submit a printed copy of your critical report (no more than five pages long), together with your “Team member evaluation sheet”, to the designated assignment box outside QB2.37 before 10am on the 9th of October.
Late submissions will incur a cumulative penalty of 10 points daily.
Grading guidelines
Your critical report will be graded out of 50 based on the quality of contents (42 points), and the quality of writing (8 points).
Attributes of quality content include but are not limited to:
- Accuracy of calculation and appropriate scope of discussion.
(30 points through suggested tasks and questions for discussion 1 to 6) - Good logical flow of discussion. (4 points)
- Relevant and focused discussion of results. (4 points)
- Critical viewpoints and hidden assumptions are appropriately discussed. (4 points)
Attributes of quality report writing include but are not limited to: - Appropriate scope and structure. (2 points)
- Clarity and coherence of writing. (2 points)
- Accuracy in spelling and use of grammar. (2 points)
- Appropriate and consistent format, and length of report within the page limit. (2 points)
The university’s Online Writing and Learning Link provides helpful tips on writing, referencing and appropriate report structure: http://owll.massey.ac.nz/