Writing Assignment 2A (Data Scientist at Amazon)
Due Date: Thursday May 13
You are currently interviewing for the job of Data Scientist at Amazon. As part of the interview process, Amazon has asked you to analyze the data set Crime Multivariable Data Set.xlsx which contains crime statistics from 50 American cities and present your findings in the form of a statistics report. The data set contains seven columns labeled X1 through X7; each row is data for a city. The reference for the data was the book Life in America’s Cities, by G.S. Thomas. Here is a description of each column:
(1) X1 = total overall reported crime rate per 1 million residents
(2) X2 = reported violent crime rate per 100,000 residents
(3) X3 = annual police funding in $/resident
(4) X4 = % of people 25 years + with 4 years of high school
(5) X5 = % of 16 to 19 years olds not in high school graduate and not high school graduates
(6) X6 = % of 18 to 24 year olds in college
(7) X7 = % of people 25 years + with at least 4 years of college
In this project, Amazon would like you to treat X3 through X7 as independent variables (i.e. as x-variables) and X1 and X2 as dependent variables (i.e. as y-variables). Amazon would like you to study the effects of X3 through X7 on X1 and X2 respectively. Here is the format for your report:
1. Introduction: Here you should describe the problem you are investigating as well as given a detailed description of the data set you are studying (in this case the data is crime statistics from 50 American cities). Specifically, specify the independent variables in this data set and the dependent variables that you are trying to explain or predict. In this section, formulate hypotheses (or educated guesses) on the impact of X3 through X7 on X1 and X2 respectively. For example, do you expect a positive or negative correlation between (a) X3 and X1, (b) X3 and X2, (c) X4 and X1, (d) X4 and X2, and so on. Also, which three pairs of variables do you expect to have the strongest correlation? Explain your reasoning.
In formulating your hypothesis, discuss what the literature has to say on the relationship between (1) crime and police funding and (2) crime and education. Use a minimum of 4 references. The references may be books or journal articles.
2. Analysis and Results: As the name indicates, this is the section where you will do your analysis and report your results. Specifically, calculate the correlation coefficients between (a) X3 and X1, (b) X3 and X2, (c) X4 and X1, (d) X4 and X2, and so on. Organize your results in the form of a table. Which three pairs of variables displayed the strongest correlations? Do your results agree with your hypotheses? Propose an explanation for the results that you are obtaining. For each of the three pairs of variables with the strongest correlations, compute the equation of the regression line and plot its scatterplot and regression line on a graph. (Hence, your report will contain three graphs in total.) In addition, compute the relative squared error for each regression line. The relative squared error is defined as follows:
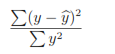
where y is the estimate given by your regression line. Which of the three regression b line had the smallest relative squared error? Discuss.
3. Conclusions: Here you will give a summary of your results and discuss possible directions for future research.
4. References: Here you will list any references that you used. Here is one commonly used format for citing research papers:
E. Parzen, “Maximum Entropy Interpretation of Autoregressive Spectral Densi- tites”, Statistics and Probability, 1, pp. 2-6. (1982).
Here is one format for citing books:
M. B. Priestley, Spectral Analysis and Time Series, Academic Press, (1981). Alternately, you may use the APA format for citing references.
Note: If you use any books or articles for your report, do NOT plagiarize! Plagiarism is easily detected using software. Explain everything in your own words.