Simulation Experiment Assignment
Management wants to study Terminal 3 at a hub airport with an eventual eye toward improvement. The first step is to model it as it is during the 8 hours through the busiest part of a typical weekday. We’ll model the check-in and security operations only, that is, once passengers get through security they’re on their way to their gate and out of our model. Passengers arrive one at a time through the front door with interarrival times distributed exponentially with mean 0.5 minute (all times are in minutes unless otherwise noted). Of these passengers, 35% go left to an old-fashioned manual check-in counter, 50% go right to a newfangled automated check-in kiosk, and the remaining 15% checked in online and proceed directly from the front door to security. It takes the online check-in customers between 3 and 5 minutes, uniformly distributed, to make the walk from the front door to the entrance of the security area; the other two passenger types take between 1 and 2 minutes (uniformly distributed) from their arrival to the counter or kiosk.
There are two agents at the manual check-in station, fed by a single FIFO queue; manual check-in times follow a triangular distribution between 1 and 5 minutes with a mode of 2 minutes. After manual check-in, passengers walk to the security area, a stroll that takes them between 2.0 and 5.8 minutes, uniformly distributed. The automated check-in has two stations (a station consists of a touch-screen kiosk and an employee to take checked bags; view a kiosk-employee pair as a single unified unit, that is, the kiosk and its employee cannot be separated), fed by a single FIFO queue, and check-in times are triangularly distributed between 0.5 and 1.5 with a mode of 1. After automated check-in, passengers walk to the security area, taking between 1 and 3 minutes, uniformly distributed, to get there (automated check-in passengers are just quicker than manual check-in passengers at everything).
All passengers eventually get to the security area, where there are six stations fed by a single FIFO queue; security-check times are triangularly distributed between 2 and 7 with a mode of 3 (this distribution captures all the possibilities there, like x-ray of carry-ons, walking through the metal detector, bag search, body wanding, shoes off, laptop checking, etc.). Once through the security check (everybody passes, though it takes some longer than others to do so), passengers head to their gates and are no longer in our model.
Simulate this system for 50 replications of the 8-hour period and look at the average queue lengths, average times in queue, resource utilizations, and average total time in system of passengers (for all passenger types combined). This is your baseline of the existing system (row 1 of the table on the next page).
Next, set up an experiment that looks at the following resource options:
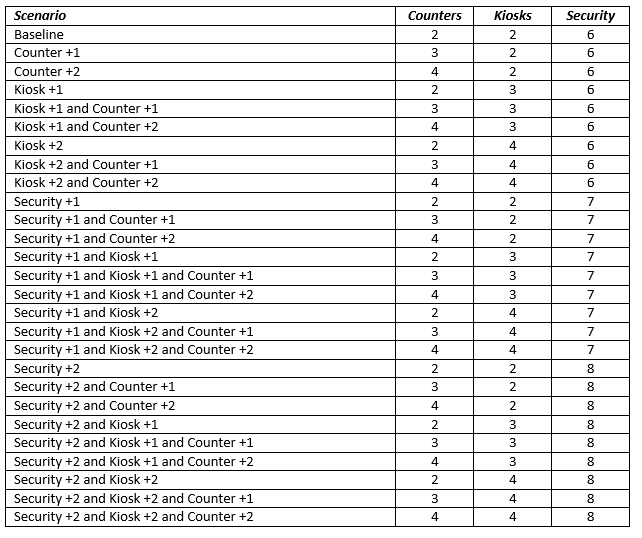
Based on the results of your simulation experiment, what do you recommend? Your recommendation can include resourcing decisions, a plan to alter the percentage of customers using online check-in or automated kiosks (since those are cheaper and more efficient!), or some combination. Keep in mind that to check the alternative of altering customers using the more efficient online and kiosk options, you’ll have to work that into an experiment as well (like I provided for the resourcing options…although you don’t have to get as crazy as I did, a few options will suffice).
Compile your RELEVANT results into easy-to-read tables and/or graphs that translate your output into a visual story that supports your recommendation, along with a brief summary of your thinking and recommendation. Keep it pithy!
Deliverables:
- Summary report in Word (see above)
- Simio model file