BCHS3201: Microarray Paper
Part 3. Gene Ontology (GO) Biological Process
1. Copy the first column with the AGI# s into a new Excel sheet. Do not copy the column header. Save the file as a comma delimited file (CSV).
2. Go to https://www.arabidopsis.org/ . Click Search and select Gene Ontology annotations from the drop down menu.
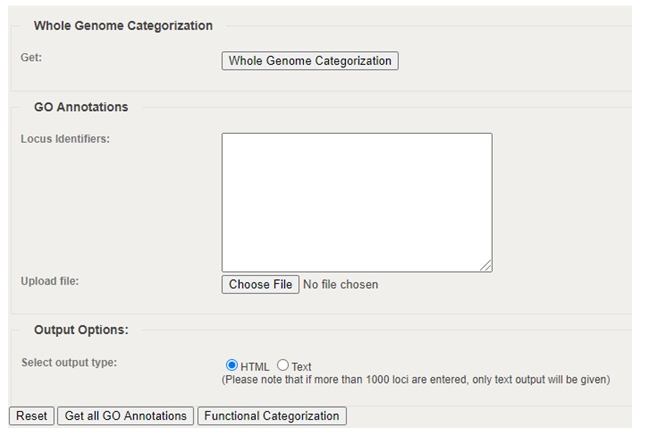
3.� Click Choose file. Select your CSV file. Click Functional Categorization.
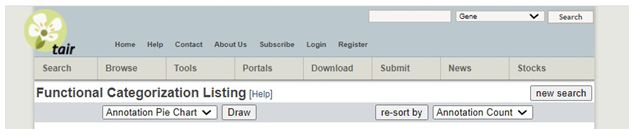
4. �Click Draw next to �Annotation Pie Chart�. �This will generate 3 pie charts: GO Cellular Component, GO Biological Process, and GO Molecular Function. You will include the GO Biological Process chart in your paper. Copy and paste that into your Word file for your paper. When you write your paper, you should discuss anything that stands out to you as particularly interesting given your chosen topic. You do not need to discuss every single category of information appearing in these charts. �You may include the other two charts in your paper if there is something in particular that you wish to highlight or tie into your discussion section of the paper but you are not required to do so.
Part 4.
Selecting a gene of interest for detailed study.
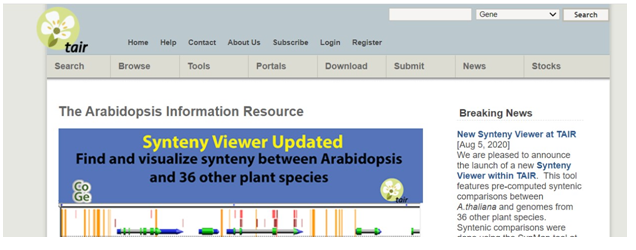
Information is continuously being added to our knowledge base.  Many genes have been identified since the data in this particular data set was first collected.  If you want to see if more information is available for a particular gene that has a particularly striking fold change, you can check TAIR, the Arabidopisis Information Resource at  https://www.arabidopsis.org/.
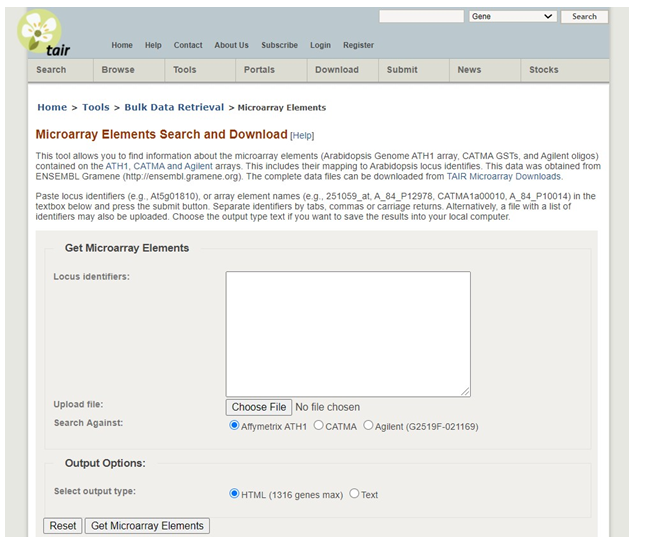
Click Search:
Click Microarray Element from the dropdown box. Enter your locus identifier in the box (example: At5g01810). Make sure Affymetrix ATH1 is selected (this is the type of chip our data set is from) and click �Get Microarray Elements�.
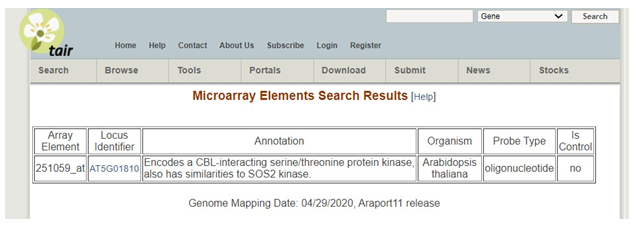
To get detailed information on a gene of interest.
In this example, information about the gene can be found under the annotation.
You will want to select a gene that from your dataset that is strongly up or down-regulated (a fold change of 3 is preferred but you may go as low as 1.5-fold if necessary for the purpose of this assignment). You need to select a gene that has been studied in the past. Skip ones that are listed as unknown function in both our data set and when you look it up in the search above.
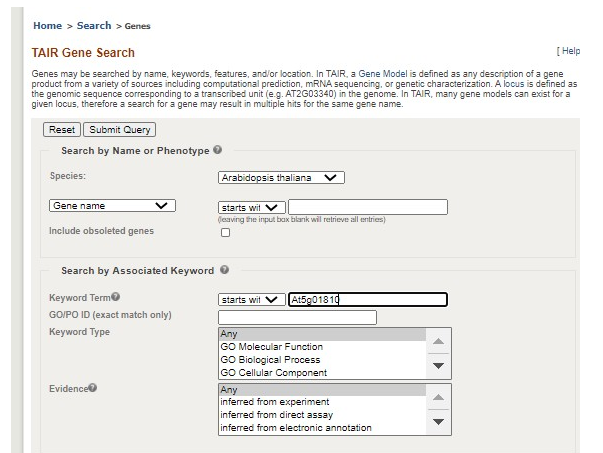
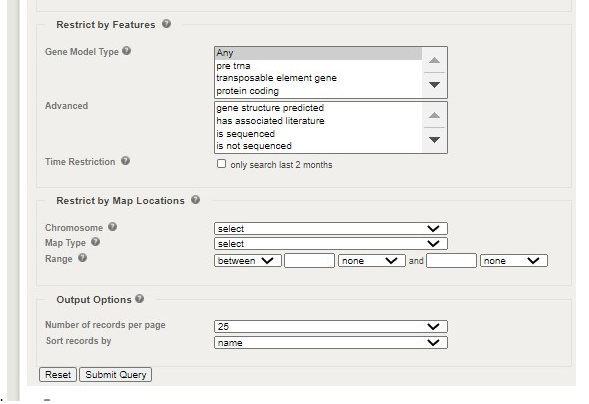
Next, click the search box in the top left corner again and this time select �Genes�. Enter your locus ID (example At5g01810) in the �starts with� box under the Search by Name or Phenotype section. Scroll to the bottom of the page and hit �Submit Query�. Select your locus from the list by clicking on the blue locus identifier.
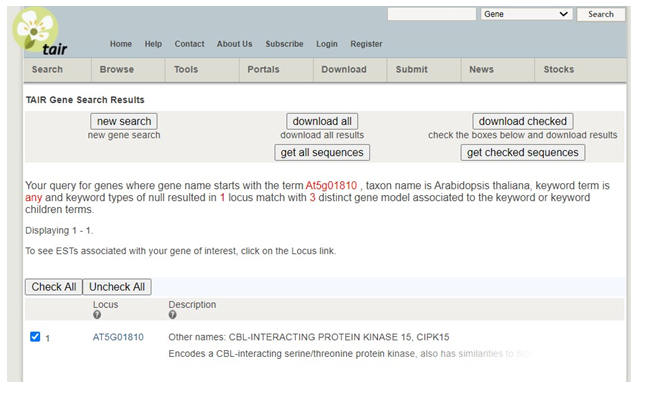
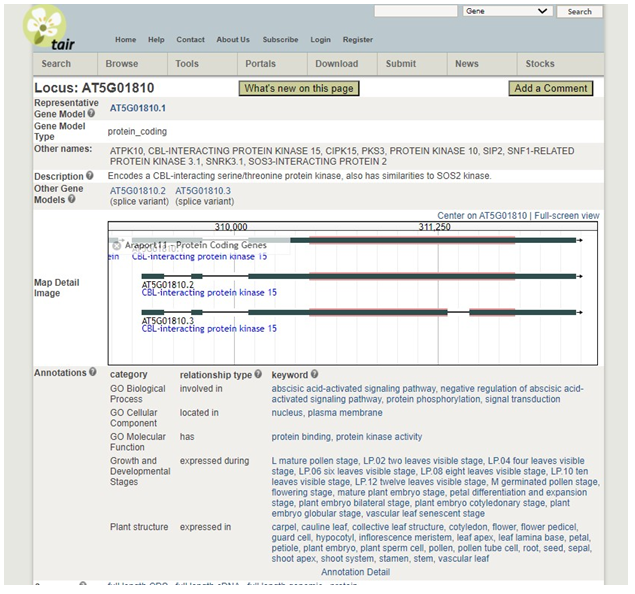
If the gene has been previously studied, a wealth of information will be available on the next page. Information to include in your paper:
1.  Gene locus
2. Other names for the gene:
3. Biological Processes in which the gene plays a role (GO Biological Process)
4. The cellular component in which the protein product is expressed (GO Cellular Component)
5. Growth and developmental stages when the gene is expressed
6.� The plant structures where the protein product of the gene is expressed
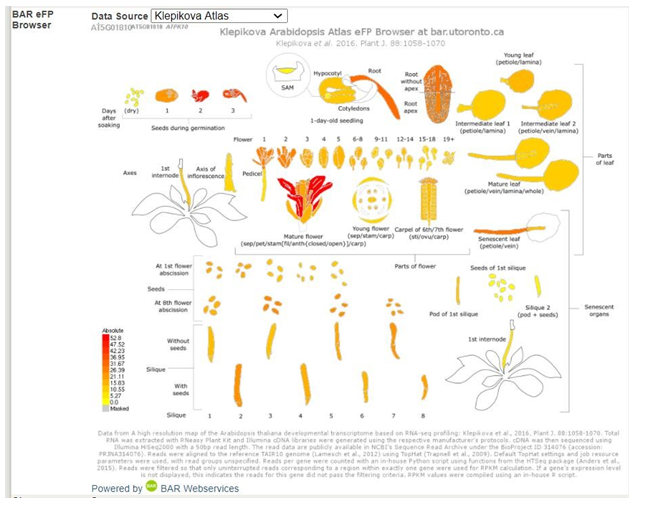
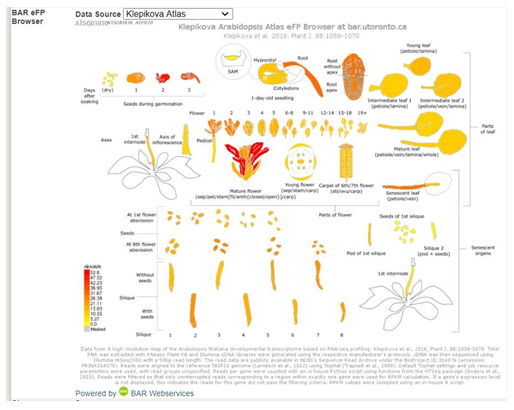
Take a look at the BAR eFP (The Bio-Analytic Resource for Plant Biology electronic fluorescent pictograph) data.�� This is a browser engine that �paints� data from genomic data sets, such as microarrays, ont pictographs that repsent the experimental samples used to generat the data set. The purpose of the tool is to help researchers develop testable hypothesis based on the enormous amount of data generated by genomics projects. �If you click the Data source you have options you can select that will provide you with information on experimental work others have conducted to study this gene. The informationwill be in a nicely illustrated summary form. The original reference will be included on the page as well.
Another example for the same gene:
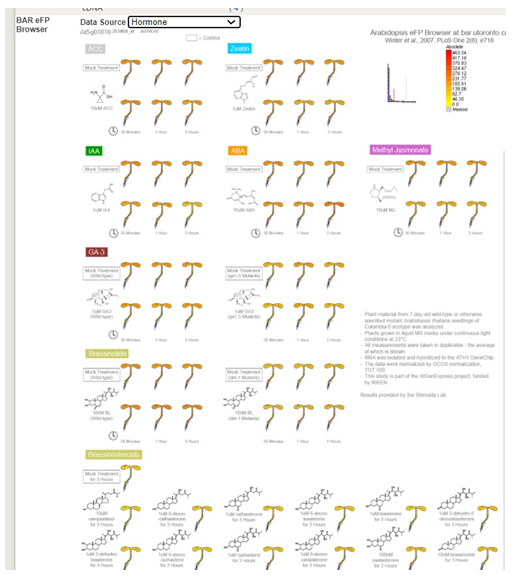
This is a great place to look for information on your gene to use in your narrative. You should cite the original papers if you use the information in this section. �You may need to go back to the original paper for details or clarity.
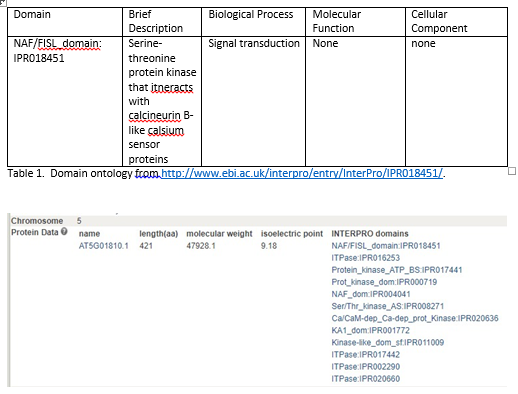
Under the Protein Data section, you will find the following information to include in your paper:
1. Protein Length
2. Molecular weight
3. Isoelectric point
4.� List of InterPro domains: �Create a table of the domains and their function (if the function is known). Click on the links.� This will take you out to the InterPro site where you will find info on the domain. �The information in the description might provide some useful information to include in your manuscript. In the table, you should indicate a very BRIEF description of whatever you think is most relevant about this particular domain (think about what your microarray experiment was to help you decide what might be the most useful information to include in the table) and the biological process, molecular function or cellular component that is applicable to the domain (see under GO terms). If no information is available, record �none� in your table. Example:
All the way at the bottom of the TAIR page, you will find a list of publications related to the gene. Use these publications as references for your paper.
Part 4.  Write your microarray paper.
Your microarray paper should contain the following components:
2. Introduction:  Be sure to state the purpose of the study, why the experiment was conducted, review previous works of others in the field (integrated seamlessly, not one reference after another). How a microarray works is not needed here. Assume your reader is familiar with this now long-standing, common-place technique. Focus on your topic (osmotic signaling, sugar signaling, phytohormone signaling, or the interplay between sugar and phytohormone signaling).
4. Discussion:
a. Recap you results. Take a look at the descriptions for the genes that are up or down regulated. Now look at the review of literature you selected for homework. �Are there genes on the list that you would expect to see based on the literature? Looking at the descriptions, are there genes that make sense to see? If you are looking at sugar, are there genes that are obviously part of sugar metabolic pathways or involved in photosynthesis? If you are looking at phytohormones, do the receptors to your chosen phytohormone appear on the list? You might want to pull up journal articles on some of the genes appearing on the list to explain why they might be appearing on your list. �Include a few suggestions for future experiments that could be conducted to expand our understanding of your