Solved: Statistical Data Analysis

Problem description:
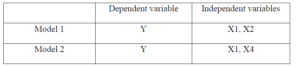
The data set in the excel file contains:
  • Data about the number of air passengers in both domestic and international flights in Australia from 1970 to 2015. This variable is the dependent variable denoted as Y.
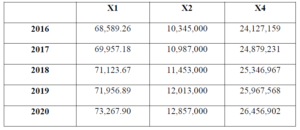
  • GDP per capita of Australia from 1970 to 2015, denoted as X1.
  • Data about the total number of departures and arrival of international tourism in Australia from 1995 to 2015, denoted as X2 and X3.
  • Total population of Australia from 1970 to 2015, denoted as X4.
You are required to use the Microsoft Excel package (the data analysis section) to finish the specific tasks below. You are required to submit two file: one excel file and one PDF file. Your Excel file should contain all the required analysis, individually addressed in each sheet with proper sheet name in your file. Your PDF file must clearly contain the responses (analysis of the results in your Excel file) to the required task. If required, please put a snapshot of your Excel file in the file. Please note that 1 mark of your total marks are assigned to the appearance of your reports. Your Excel file must be in working condition. To understand the details of marking scheme, please refer to the rubric provided in Canvas. Required tasks: Task 1: Present a scatter plot including all variables (dependent and independent variables) in one chart, and comment on their linear trends using R2. Add the linear trend lines to all the time series. (3 marks) Task 2: Apply bivariate regression analysis between Y and all the independent variables. Discuss about the correlation between each two variables using adjusted R2 and P-value. Write the estimated equation of Y for each regression model. Briefly comment of the Residual Plots. (6 marks) Task 3: Run the following multivariate linear regression models: Discuss about the correlation between each two variables using adjusted R2 and P-value. Write the estimated equation of Y for each regression model. Briefly comment of the Residual Plots. (6 marks) Task 4: Forecast the values of the dependent variable using the all three models in Task 3 for Year 2016 to 2020 and briefly explain the results of these forecasts (the assumed forecasted values of independent variables are given below; use the relevant values to forecast the Y values). Discuss about the reasons of the differences in Y values. (4 marks)