US Economy Analysis
The USA inflation has fallen to 0.2% in 2015, however, the utility price have remained constant. Rather it was attributed to plunging oil prices. These factors combined with low prices from commodities, imported food, energy, are expected to further push down inflation, and a possibility of deflation. This will make life easier for any form of formal employment.
The U.S.A external sector (X-M) is analyzed via Trade Balances and Exchange Rates (ER). The Dollar appreciation, especially against Euro, leads to increasingly expensive exports causing negative trade balances. Inflationary pressure and the role of trade exports are predicted to be minimal, as US’s major trading partners are experiencing minimal recovery. The Eurozone, among the U.S.A’s largest export market is experiencing negative inflation and low levels of short-term Interest Rates. In USA, GDP and unemployment indicators improved slightly. China’s growth is slow as two major sectors; investment and construction are performing weakly. Growth in Japan is poor, with GDP being revised downwards. growth in emerging economies is also slowing (30).
From Supply-side factors, Wage Growth has been subdued in Q3 2014, but picked up in Q4 at rates higher than Productivity Growth. Increasing Employment rates (27), this implies unit labour cost growth is increasing. In terms of wage-settling, this helps reduce slack in the labour market, increasing the likelihood of wage growth. However, approximately 40% of pay settlements will only be negotiated in April when CPI is predicted at around 0% which may feed into poor wage growth.
Inflation Expectations is vital in determining investment and savings. Medium-term inflation expectations for households and firms have fallen, thereby increasing economic uncertainties. This creates upwards pressure on savings and downwards pressure on consumption. Expectations on oil prices increasing to $70 by 2017 reflects boosted investment in terms of £ to purchase oil, thereby increasing its quantity in global money markets and causing a potential depreciation (13).
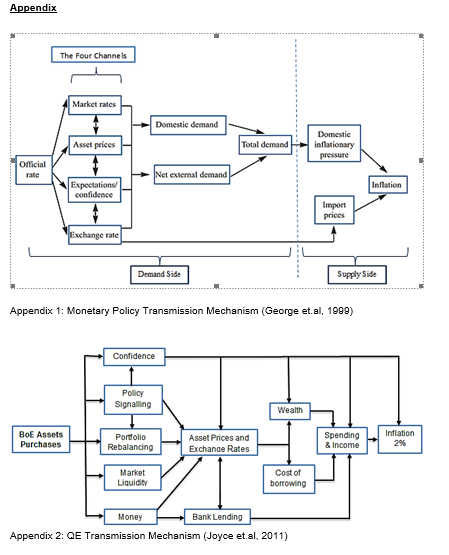
Next section describes how these insights are translated into BoE’s decision-making. Typically, BoE can change bank rates to influence inflation through four channels shown below. Recent developments have shown that any inflationary pressures will not originate from demand-side factors.
From demand-side perspectives, changes in BR (signified above by Official Rate) trigger fluctuations in Market Rates which affects private-sector spending patterns; C+I. While low Market Rates in previous periods ensured increased Consumption, it was largely offset by vague investment patterns, hence the necessity to maintain Bank Rates low to spur consumption further.
For Asset Prices, the uncertainties in Greece have made UK bonds more attractive for foreign investors. However, this is offset by decrease in UK’s equity prices instead. Maintaining low BRs may help stability of ensure equity prices.
Since medium-term inflation Expectations has fallen, the Committee maintains rates at 0.5% to generate upswings in spending. If BoE can entrench people’s expectations on short-term IR to be low, thereby increasing medium-term inflation expectations to the target, spending will increase now while inflation is still low.
For Exchange Rates, the appreciation of £ signifies higher export costs. Coupled with slow growth in UK’s various trade partners, it’s unlikely that trade could help boost economic activity. It seems beneficial to maintain rates low to minimize the appreciation of £
.
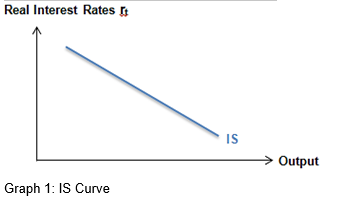
Overall, demand-side factors mostly offset each other, and are not effective enough to achieve the inflation target. Any potential domestic demand growth would be supported mainly by low energy/food prices and higher productivity growth but are largely offset by poor growth in trading partners and small overall growth in AD. As IS curve is derived from AD, there is negligible movement in IS curve.
Moving to supply-side perspectives, it embodies labour markets by showing the collective intentions of employers and labourers, and the producers’ intentions in goods and services market. These two combined displays the level of output the economy is prepared to supply.
Maintaining 0.5% rate ensures that it remains cheap for firms to hire new staff, which would explain increasing employment rates and total number of hours worked (27). The slight productivity growth means that there is an increased demand for labour to support the productivity growth, again reflecting upwards pressure on wage growth (26).
Import prices is generally low due to £ appreciation. This encourages import-spending which pushes down domestic spending and subsequently domestic inflationary pressures, feeding into low inflation currently experienced.
Price and Wage Setting (PS & WS) would both affect how the supply-side of the economy develops. The main sources affecting this are slight improvements in Productivity, growth in Wages, and falling Oil Prices. The growth in productivity signifies reduction in production cost which pushes PS curve upwards. Simultaneously, wage-rates are growing at rates higher than productivity, implying increasing unit cost of labour (26). Thus, cost of production increases to pushes PS curve downwards, at levels slightly higher than the upwards PS shift from productivity. Falling oil prices feeds into lower cost of production, pushing PS upwards. The Committee had concluded that two thirds deviation from inflation is due falling oil prices (Carney, 2015). This implies that falling oil prices had larger impacts than wage growth. Overall, there is a net movement of PS upwards.
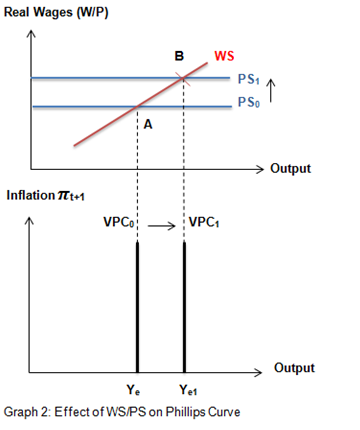
This is reflected in Graph 2, whereby the intersection point of WS and PS signify potential output Ye, PS0 moves to PS1 resulting in movements up WS to point B. The Vertical Phillips Curve (VPC) shifts rightwards to VPC1 signifying a positive output gap and new potential output at Ye1.
Combining results from the demand- and supply-side affair, the IS-PC-MR model is derived.
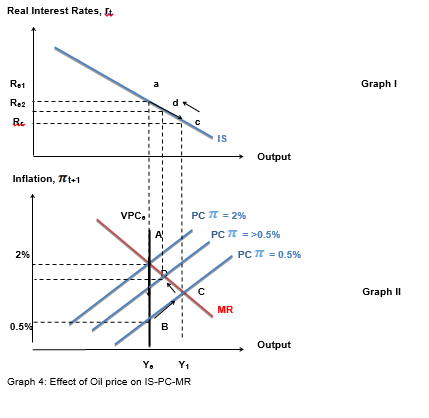
Real Interest rates, Re from Graph I maps down to the short-run equilibrium at Y0 in Graph II, whereas the medium-run equilibrium, Ye1 is derived from the movements in Graph 2 earlier. Y0 signifies the current negative output gap that has existed since the financial crisis.
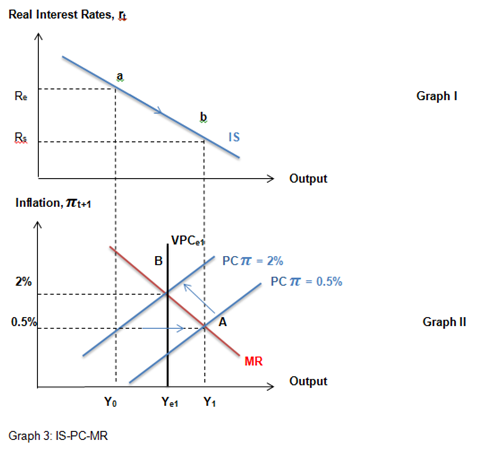
We begin at negative output gap Y0.The BoE sets stabilising rate; Rs, at 0.5% which moves Real Interest Rates; Re, down IS curve to point b in Graph 1, which is then mapped down the short-run equilibrium to A at Y1, signifying a positive output gap. At point A, economy is producing above its capacity due to excess demand. Prices would rise in response to demand-pressures leading to increasing inflation. Point A moves up along MR back to the inflation target at B. Thus, BoE should be able to consistently achieve the 2% inflation target by shifting Bank Rates down to 0.5% when necessary.
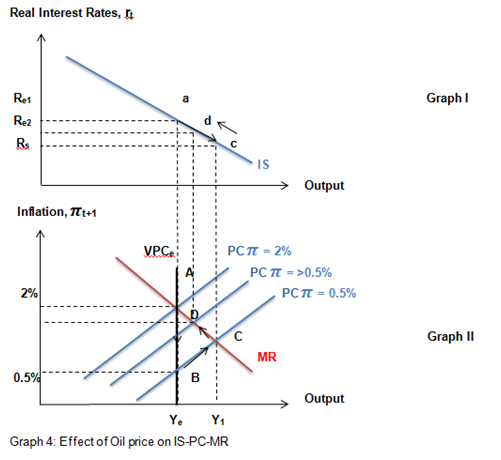
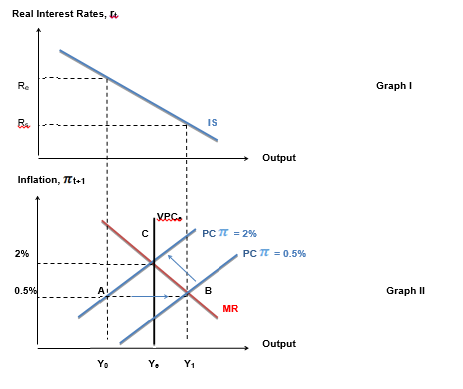
If the decreasing oil price is persistent, it would lead to a negative inflationary shock as dropping prices cause inflation to remain low. Graph 4 depicts how BoE can counter oil shocks with the 2% target. Inflation from 2% target at A falls down to 0.5% at B. In order to go back to target, BoE sets the stabilizing rate; Rs, at 0.5%, causing movement down IS from Point a to Point c in Graph I. This is mapped to movement up the Phillips Curve, PC=0.5% from B to C in Graph II, leading to a positive output gap, Y1. Interest rates are incrementally increased again to close the gap, reflected by movement along IS back to a in Graph I, mapping to gradual movements up MR from C to A in Graph II.
The MPC can only constantly achieve target if the economy is operating close to potential capacity. While inflation is below target, unemployment is above long-run sustainable rate. Thus, there is no direct trade-off between achieving inflation target and promoting economic growth. The remaining hurdle is to eradicate all remaining traces of slack, possible once energy price have stabilised. The Committee identified that remaining slack could be absorbed by spare capacity in labour.
For oil prices, decreasing prices would affect both demand and supply-side. As UK is a net-importer of oil, it would help induce consumption and reduce cost of production. However, its full effects are difficult to determine and could likely be temporary. This depends on how long the situation persisted, the OPEC’s decisions on supply, and people’s expectations on future prices. The effects of oil price could develop into a temporary inflation shock that is self-corrective once prices stabilize. The Committee asserts that prices must be monitored closely in upcoming months.
The Committee maintains that growth in AD is still too weak to hit the inflation target on its own considering that a negative output gap still exists even with low Bank Rates. While rates can be lowered, theoretically even pass the zero-bound, it may not be feasible considering the circumstances.
It’s unnecessary to cut rates lower although AD growth was limited, considering potential positive-inflationary pressures that can stem from future wage-rate growth. Since rates are zero-bounded, BoE cannot cut them lower without experiencing spill-over effects. It adversely compresses commercial banks’ net interest margin and profitability. This hurts their ability to rebuild and lend capital to the public, countering the purpose of boosting lending.
While BoE can set rates below zero, there are associated risks resulting in the conversion of reserves into cash, creating the need to obtain secured storage for bank notes. Commercial banks are inclined to introduce storage charges, incentivising customers to hold cash instead of depositing into banks. Such considerable amounts of cash movement out of the banking system would destabilise banks abilities to carry out basic banking functions. It remains unfeasible to implement negative rates. Therefore, QE is an assured alternative for generating inflation, by injecting money into the economy to encourage nominal spending.
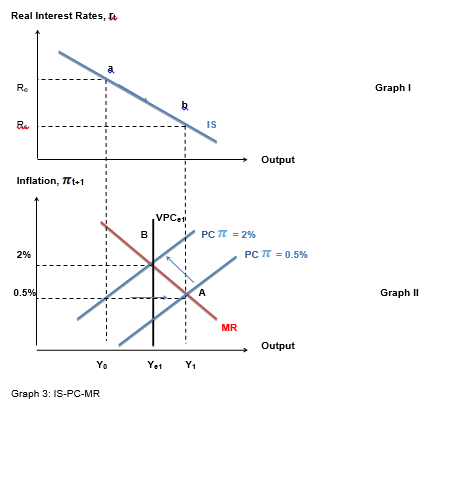
QE’s transmission mechanism works as follows. Considering that medium-term inflation expectations have fallen (8), BoE must encourage spending now by anchoring consumer expectations to target. Continuation of QE will provide Policy Signals to agents that BoE is determined to achieve the target. QE increases asset prices causing agents to Rebalance Portfolios by buying other substitutable assets. Holders of these substitutable assets will do likewise; promoting a perpetuating cycle. QE further boosts Market Liquidity as lower bond yields results in lower borrowing costs; thus encouraging trading, lending and spending. QE increases business and consumer Confidence. Since asset prices increase, UK gilt holders have confidence that QE will increase their wealth, prompting higher expenditure. When assets are purchase from non-bank institutions, the banking sector correspondingly gains new reserves in BoE and customer deposits. This perpetuates new Money lending and expenditure, boosting falling demands for secured-lending (21). These effects collectively transmit down the mechanism, boosting spending and income to reach the inflation target.
The implementation of QE is consistent with austerity measures, as BoE posits that existence of UK’s negative output is due to excess productive capacity. With the implementation of QE, the economic outlook while robust still remains slow for the medium-run. QE therefore helps to sustain the economic environment, maximise productive capacity, and fuel output growth further. Although BoE is forward-looking, time lags occurring between changes in BR and nominal spending must be allowed. Ostensibly, more time is needed to observe the positive effects of QE (Carlin & Soskice, 2005).
In conclusion, the Committee has forecasted steady but slow global economic growth with UK’s major trading partners seeing sluggish growth (15, 16, 17), coupled with decreasing oil prices and potentially poor inflation expectations,. While dropping oil prices help boost GDP growth in the medium-term, these shocks are regarded as temporary, accredited to being a supply-side issue. Its full effects need to be ascertained before the Committee is in a position to change Bank Rates. The Committee has unanimously decided that the best approach is to maintain rates at 0.5% to spur economic growth and employment further. (35).
References
Bank of England (2015) Minutes of The Monetary Policy Committee Meeting. London: United Kingdom.
Bean, C. (2013), Letter from Deputy Governor to Chairman of Treasury Committee, Bank of England Letter
Carlin, W. and Soskice, D. (2005) The 3-equation new Keynesian model — a graphical exposition. Contributions to Macroeconomics. 5 (1), pp. 1-36.
George, E., King, M., Clementi, D., Budd, A., Buiter, W., Goodhart, C., Julius, D., Plenderleith, I. and Vickers, J., (1999), The transmission mechanism of monetary policy, Bank of England.
Joyce, M., Tong, M., & Woods, R. (2011), The United Kingdom’s quantitative easing policy: design, operation and impact, Bank of England Quarterly Bulletin.