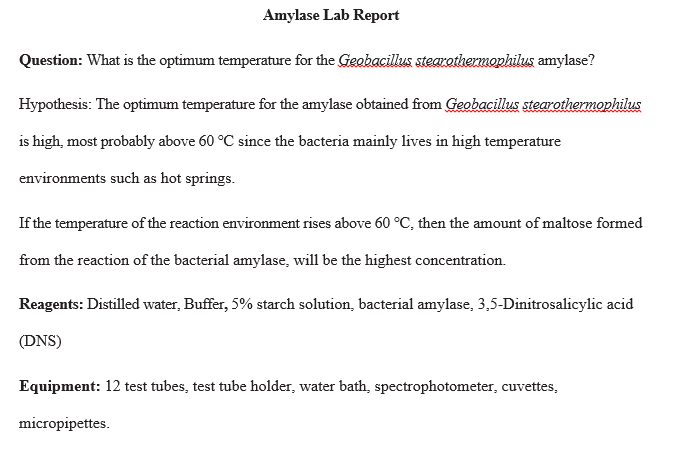
BIOL 150 Amylase Lab Report
This is the data table used to write the report
Data from the Study of the Effect of pH on Human Amylase Activity
| pH | Absorbance at 540nm | Maltose produced (mg/ml) | Amylase Activity (mg/ml/min) |
| 1 | 0.029 | 0.008 | 0.0008 |
| 3 | 0.103 | 0.023 | 0.0023 |
| 5 | 0.267 | 0.054 | 0.0054 |
| 7 | 0.945 | 0.186 | 0.0186 |
| 9 | 0.112 | 0.024 | 0.002 |
| 12 | 0.015 | 0.006 | 0.0006 |
Rubric Enzyme Report (40 points)
- Introduction: (4 pts)
- What are enzymes and what do they do?
- What are the optimal conditions for an enzyme?
- What factors affect enzyme activity and how?
- How is the structure of an enzyme related to its function?
- What is amylase? What reaction does it catalyze?
- Research the amylase enzyme you used (organism) and the optimal conditions of temperature, pH, or salt, it requires.
- Explain why DNS is used and why it is important for determining enzyme activity. Cite and reference your sources using APA style.
- Experimental Design: (5 pts)
- State your question, hypothesis (ensure that it is testable and falsifiable), and prediction.
- Identify the independent variable.
- Identify the dependent variable.
- Identify the experimental group
- Identify the control group.
- Materials/Methods: (3 pts)
List all of the equipment and materials you will need for your experiment. BRIEFLY describe your experimental procedure for setting up the maltose standard curve (Part II) and for testing your hypothesis on amylase (Part III).
- Data Analysis/Results:
- List all the formulas you used for your calculations and a sample calculation in each case (3 pts)
- Prepare the following tables:
- Table 1 with maltose standard curve data. (3 pts)
- Table 2 with your experimental setup. Explain how your control tubes will be set up. (2 pts)
- Table 3 with absorbance measurements of experimental tubes, calculated maltose concentration, calculated amylase activity (mg/ml maltose/min) (4 pts)
- Prepare the following graphs:
- Graph 1 of maltose standard curve: show line of best fit and equation of line if done on excel. If done manually, insert an image of your graph indicating the line of best fit. (3 pts)
- Graph 2 of enzyme activity versus independent variable (4 pts)
- Summary of results: summarize your results based on your graphs (3 pts)
- Conclusion/Discussion: (4 pts)
Based on your results, is your hypothesis supported? Restate your hypothesis and explain! Discuss any other findings and explain them. Discuss errors, and reasons for data variability.
- References: (2 pts)
List the sources you used at the end of your report, and include in-text citations in your report(APA citation style)
Solution