Biol 230 - Epiphyte distribution
Epiphyte Diversity and Distribution on Tree Trunks
Learning Objectives
● Calculate alpha, beta and gamma diversity on a dataset that you have collected
● Compare coniferous and deciduous trees as habitat for epiphytes
● Use survey data to infer realized niche width for each species of epiphyte
● Construct a species-area relationship that describes how the number of species in a fixed area changes with tree diameter.
Before you go into the field:
(1) Practice epiphyte identification in a pre-lab. (2) Read this document, and do the pre-lab quiz.
Introduction
This lab investigates the distribution of epiphytic organisms living on the bark of trees around UBC campus. Epiphytes grow only in situations where their realized niche is fulfilled, therefore their distribution on different species of tree allow us to learn about their niches. Coniferous and deciduous trees can differ as suitable habitats for epiphytes, for example because of differences in bark chemistry or in available light, see: https://njaes.rutgers.edu/pubs/fs1205/
Trees on campus are labelled with metal tags, your group will be assigned to a specific set of three trees for sampling.
Methods
Field
1. For each tree, record: tree species (use four letter code from datasheet), tag number and tree size. For tree size, measure the circumference in cm with the tape at 150cm above the ground. Then divide the circumference by ? to convert to dbh (“diameter at breast-height”).
2. Using the compass, determine which side faces north, south, east and west. On each side, you will sample at three heights off the ground: 0, 75 and 150cm. Therefore you will sample 12 times per tree.
3. For each sample, pin the transparent quadrat (3x3 cells) onto the bark. Identify all species present on the quadrat and record the species code (see list of codes on datasheet). For each species, count how many of the 9 cells it is present in. The count data will therefore be a number between 0 and 9.
Data analysis
Please upload your data to our website (www.zoology.ubc.ca/EcologyLabs/), by the deadline determined by your TA. Please be very careful to input tree diameter not circumference (remember to divide circumference by pi).
Once everyone in the class has uploaded their data, you should then download the full dataset and do the following two data analysis tasks in order to complete your Report.
Task 1: Alpha, beta and gamma diversity
Your task is, for each species of tree, calculate the average alpha diversity of moss and lichens on an individual tree and gamma diversity: the total number of moss lichen species that can survive on that particular tree species. Once alpha and gamma diversity are calculated, you can then calculate beta diversity from the equation: alpha + beta =gamma. In general, beta diversity can be calculated either between habitats, or within habitats. In this particular exercise, we will calculate beta diversity within habitats (i.e. within tree species). Please only calculate alpha, beta, gamma diversity for tree species where at least 30 individuals have been sampled, as random variation in small sample sizes can give misleading results. We will use the data from tree species with less than 30 individuals in a later question.
Alpha diversity. The easiest way to do this is, for each row of data, count the number of non- zero cells. That would take far too much time to do manually. Fortunately there is a command for this: COUNTIF. For example, if we write =COUNTIF(A1:C1, “>0”) in cell D1:
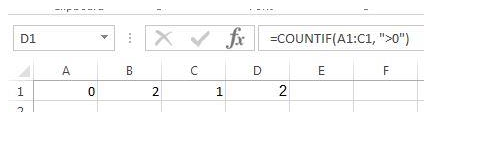
then Excel will return the value “2” in cell D1, as two cells (B1, C1) in the range A1:C1 have a value greater than zero. Now that you know alpha diversity for each tree, you need to calculate the average alpha for each tree species. The easiest way to do this is sort your data by tree species. To do this, select all the data on your spreadsheet, then go to the Data tab, and select Sort. In the dialog box that pops up, select sort by the column that your tree species labels are in. Now all the records for the same tree species will appear next to each other, making the next task easier.
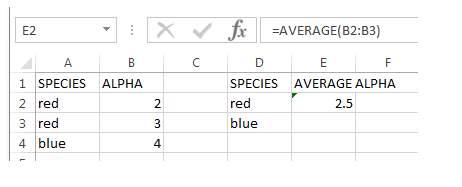
Once the data is sorted by tree species, calculate the average alpha diversity for each tree species in turn. The command here is: AVERAGE. For example, in the data below, species red has 2.5
species on average which can be calculated by entering in cell E2 this formula: = AVERAGE(B2:B3):
Gamma diversity. For each tree species, you need to determine the total number of lichen and moss species found on at least one individual tree of that species. The simplest way to do this is to use the countif command to count the number of non-zero values for each lichen and moss species. Here we first counted up the number of Red trees that “This Moss” species occurred on, using the command =COUNTIF(B2:B4,”>0”) in cell F2. Excel returns a value of “0” as “This moss” never occurred on any of the sampled Red trees:
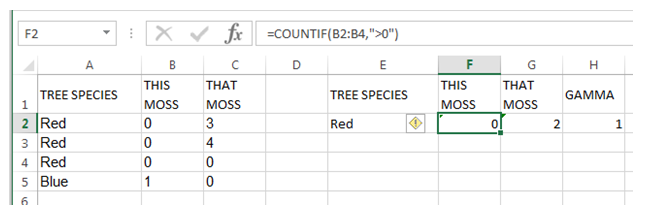
If we repeat this calculation for “That moss” (i.e. write =COUNTIF(C2:C4,”>0”) in cell G2 we learnt that “That moss” occurred on two red trees. But what we are really interested in is how many moss species occurred on any Red trees, and for that we can write =COUNTIF(F2:G2, “>0”) in cell H2 as below. Now we learn that one species of moss (“That moss”) was found on the sampled Red trees:
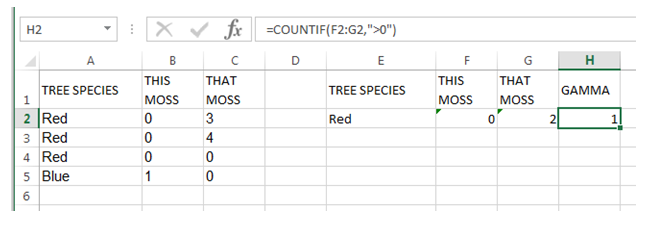
Therefore, the gamma diversity of lichens and moss on the Red tree species would be one, as only one moss species was ever found on this species of tree.
Beta diversity. Calculate from alpha and gamma for each tree species, using the equation alpha
+ beta =gamma
Sample size. How many trees were sampled for each species? You could count manually, but you would be sure not to make a mistake if you used either a COUNT or COUNTIF command!
Task 2. In the previous task, you considered each tree to be a habitat, and calculated diversity within this habitat. Now, we will look at each individual species of epiphyte, and ask how many habitats (= tree species) each particular epiphyte occurs on. This is a measure of the realized niche of the epiphyte. Calculate the realized niche of each epiphyte species.
Task 3. For each tree species separately, we will ask if there is a relationship between tree size and alpha diversity. Even though exactly the same area of bark on each tree was surveyed, larger trees may still have the capacity to support more species. In lecture, we will have discussed this idea in the context of species-area relationships. Again, we will only consider tree species with at least 30 individuals sampled to avoid statistical problems associated with small sample sizes.
To test if alpha diversity is correlated with tree DBH, you can use the CORREL function.
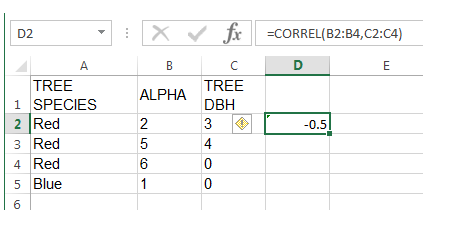
For the Red species we can enter in cell D2 the command =CORREL (B2:B4, C2:C4), which will return a correlation coefficient of -0.5. Correlations coefficients are always a value between -1 and +1. If alpha increases perfectly with Red tree DBH, this correlation coefficient will be +1. If alpha decreases perfectly as Red tree DBH increases, the correlation coefficient will be -1. If there is no relationship between alpha and Red tree DBH the correlation coefficient will be 0. Of course, your correlation coefficient will not be any of -1,0 or +1, but something in between. How do you know if it is significantly positive or negative, or not significant? Enter your correlation coefficient (also called “r”) and your sample size into the text boxes in this site: http://www.danielsoper.com/statcalc3/calc.aspx?id=44
and record the p-value. If the p-value is <0.05, the trend is significant. If the p-value is>0.05, it is not significant, meaning that any correlation you see in the data is probably “just a fluke” (randomly generated).
For just one of your tree species, prepare a scatterplot with tree DBH on the x-axis, and alpha diversity on the y-axis (Select your x and y data with the mouse, then click on Insert>Charts>Scatter). Tip: If your x and y data ranges are not adjacent with the x datarange on the left, you can select the x data, then hold down the Ctrl key on a PC or Command key on a Mac, and as you hold down that key select your y data: both data ranges should then be selected.
Moss & Lichen Report.
The following report should occupy no more than 2 pages, the first page of which is only Q1 and
2.
1. Hand in this data table, filled in. If the sample size for a tree species is < 30 just write “NA” in
the data cells for that tree species.
| Tree species | Sample size | Alpha diversity | Gamma Diversity | Beta Diversity | Correlation coefficient (r) with tree DBH | p-value for correlation |
2. Attach a plot, for one of your tree species, with tree DBH on the x-axis, and alpha diversity on the y-axis.
3. Compare deciduous and coniferous tree species in terms of alpha, beta and gamma diversity. Which type(s) of diversity differed most between deciduous and coniferous tree species?
4. Give an example of a lichen or moss species that showed one of the broadest realized niches. Give an example of a lichen or moss species that showed one of the narrowest realized niches. Explain why our data can be used to determine the realized niches of epiphytes, but not their fundamental niche.
5. How does the realized niche of epiphytes (lichens and moss) determine the gamma diversity of epiphytes on each species of tree?
6. Was the alpha diversity of epiphytes on a species of tree better predicted by the diameter of the tree, or by whether the tree was deciduous or coniferous? Use concepts from lectures to describe which of the three processes of sampling effects, island biogeography and habitat diversity could not affect the relationship between tree diameter and alpha diversity given the way we sampled. Use concepts from lectures to describe some of the ecological processes that may underlie any difference between deciduous and coniferous trees on alpha diversity (be sure to read: https://njaes.rutgers.edu/pubs/fs1205/).