Lab 8: Bacterial Growth Curve
Name: _______________________________ BIO 239 (Prof. Garcia-Rios)
Bacteria, like all living organisms, grow. The time it takes for a population of bacteria to double in number is called the "growth rate." The doubling time is a fixed characteristic of each type of bacteria, and it can be used for identification.
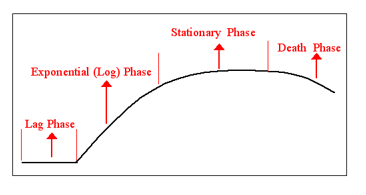
Below is a diagram of the bacterial growth curve. When a culture of microorganisms is transferred into a new container for counting, there is an initial "lag phase." During this period, the bacteria are adjusting to their new surroundings, new food source, and new temperature. They are not yet multiplying in numbers. Then, the "exponential" or "log" phase begins. During this phase of growth, the bacteria are multiplying like mad! They have abundant food and not enough toxins are around to harm them. They make as many new bacterial cells as they can. Eventually, the bacteria run out of room, space, or they have produced toxins that are limiting their growth. This begins the "stationary phase," during which the bacterial numbers are not really changing. The bacteria are still making new cells, but the same amount are dying as are being made, so the curve is flat. Finally, the number of bacteria dying becomes greater than those being created, and the numbers decline in the "death phase."
Activity: Using the simulated data below (this is not from an actual experiment, but the data is typical of what you would find for a species of bacteria like Escherichia coli, (which multiplies fairly quickly), make a graph of a bacterial growth curve and calculate the growth rate.
When microbiologists count bacteria, they often can't count all the cells in the sample. Instead, they dilute the sample by taking a small volume of sample and mixing it with a larger volume of clean, sterile solution. (NOTE: Unless you are familiar with how dilutions work, please make sure you have completed the “Dilution Worksheet” found below, before attempting to graph the data!). The scientists then spread the mixture onto an agar plate and count the number of dots (called colonies) that grow. The number of colonies that grow on each plate are called "Plate counts." Most scientists do more than one plate count for each sample and take the average of their results.
In the simulated data below, samples were taken from the growing bacteria culture over time, diluted, then grown on a plate. You should average the three plate counts given, then calculate the number of cells that were in the actual sample based on the dilution factor given. For example, the first set of plate counts are: 200, 205, 213. The average of these numbers is 206. The dilution factor is 10^4. That means that for each cell counted on the plate, there were 10^4 or 10,000 living cells in the culture. So, there were 206 x 10^4 cells in the culture at the beginning of the experiment (when time = 0). BUT, that number is not in scientific notation properly! In order to record this number correctly, it should be 2.06 x 10^6.
Please fill in the table below with the correct numbers.
| Time (minutes) | Dilution Factor | Plate Counts | Average Plate Count | Number of living cells in the culture |
| 0 | 10^4 | 200,205,213 | 208 | 2.08 X 10^6 |
| 15 | 10^4 | 195,215,200 | ||
| 30 | 10^4 | 192,203,214 | ||
| 45 | 10^4 | 270,255,266 | ||
| 60 | 10^5 | 42,37,40 | ||
| 90 | 10^5 | 80,83,78 | ||
| 120 | 10^5 | 175,168,185 | ||
| 150 | 10^6 | 42,32,37 | ||
| 210 | 10^6 | 50,55,53 | ||
| 270 | 10^6 | 54,49,57 | ||
| 330 | 10^6 | 51,55,48 | ||
| 390 | 10^5 | 260,253,249 | ||
| 420 | 10^5 | 180,176,183 |
Now, graph the results of the experiment using Microsoft Excel (all of you have access to this application since you are students at Bristol), or Apple Numbers (for those of you who own a Mac and do not want to use Excel). Put time (in minutes) on the x-axis and numbers of living bacteria on the y-axis.
If you need a tutorial on how to graph using Excel, here is a link to a video:
Or here is one using Apple Numbers:
This graphing exercise works best if you graph the log of the number of bacteria, instead of the numerical value itself. Either approach will be accepted.
Once you have produced your graph, please submit it, along with this file, using the assignment drop box entitled “Lab 8: Bacterial Growth Curve”.
Dilution Worksheet
A. Calculate the final dilution of each of these series. Write your answer in scientific notation. (the symbol “^” indicates “raised to the __ power”)
1. 1:1000, 1: 100, 1:100 ____________________
2. 1:10, 1:100, 1:1000 _____________________
3. 1/10, 1/1000, 1/100 _____________________
4. 10^-3, 10^-2, 10^-1 _____________________
5. 10^-1, 10^-3, 10^-3 _____________________
6. 1/100, 1/100, 1/100 _____________________
7. 1:100, 1:1000, 1:10,000 _____________________
8. 10^-2, 10^-2, 10^-1 _____________________
9. 1/1000, 1/1000, 1/10 _____________________
10. 10^-1, 10^-2, 10^-1 _____________________
B. Calculate the actual cell concentration (the number of cells per milliliter of solution) in the bacterial culture based on the plate counts and dilutions given below.
| Plate counts (number of cells per plate counted) | Final dilution (the amount that the original sample was diluted before being grown on the plate) | Actual cells per milliliter in the original culture |
| 202 | 10^-5 | |
| 157 | 1:10,000 | |
| 180 | 1/1000 | |
| 106 | 10^-6 | |
| 85 | 1:100,000 | |
| 275 | 1/10,000 | |
| 200 | 10^-3 | |
| 99 | 10^-8 | |
| 155 | 1/10,000 | |
| 198 | 1:1,000,000 |