Mull Wood Practical & Report
Mull Wood Practical & Report Instructions 2020-21 (Ecology 4209NATSCI)
Introduction
Mull Wood is a deciduous woodland on the Croxteth Park estate in Liverpool. Most of it was planted in the last 150 years but there are a few trees older than this. The wood is now a nature reserve managed by the local Wildlife Trust on behalf of the local City Council (a web search for Mull Wood, Wildlife Trust should find some details of the management). In the late 1800s century, Rhododendron, an invasive shrub species from the Iberian Peninsula was introduced to the wood and became increasingly invasive in recent decades.
The aim of the practical is to make a few ecological measurements in the wood and to study the effects of Rhododendron on soil, invertebrates, trees and the availability of light. To do this you will make the same set of measurements in an area of woodland with Rhododendron and an area without this species. Most British conservationists consider Rhododendron a problem species – this is because it is not native to the UK and can alter the environment in a way that is considered detrimental to many other species. Therefore, the hypothesis is that Rhododendron is altering the woodland environment at this site and your data should allow you to assess to what extent this hypothesis is correct.
Overall objectives
• Investigate the impact of an invasive species (Rhododendron) on the native woodland community
• Compare two areas of woodland, one with Rhododendron and one without
• Gather data on the community structure, pH, light intensity, leaf-litter invertebrates, tree density and leaf litter depth
To bring:
• Warm/waterproof clothing
• Wellies/rubber boots
• Personal medication
• Notebook and pencil/pens
• Snack/drink
Data collection
All your activities will be carried out at two study sites (plots):
- Site 1: forest patch (plot) without Rhododendron
- Site 2: forest patch (plot) with Rhododendron
At each site you mark out one plots using a measuring tape. Plot size should be ideally 22.4 x 22.4 m = 501 m2 = 0.05 ha. Within the two plots, you will make all your measurements and observations.
Six different ecological factors will be measured:
- Tree density
In both plots you will establish the number of trees and relate it to the total area in which you counted. This will give you the tree density (no. individuals/unit area; in this case 0.05 ha). What definition of tree are you going to use, or when does a sapling become a tree? As a rule of thumb: you can use the circumference of the circle that is formed when your two pointer fingers and your two thumbs touch each other, as a measure to determine the circumference of the tree trunk. Anything smaller than the circumference is considered a sapling and is thus not included into your count. Any trunk wider than your circumference is considered a tree and therefore counted. Since you have only one value for each plot, you are not able to apply any statistics here.
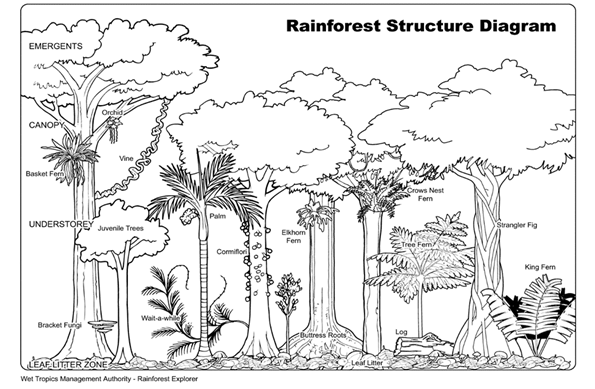
- Description of forest community structure (forest stratification diagram)
Look at the vertical structure of the woodland and identify the main layers/strata (ground or herb layer, shrub layer, small tree canopy layer, upper canopy layer). Sketch a vertical cross-section through the wood, labelling the main strata/layers. See below for an example of a similar cross section, in this case from a tropical rain forest. It must be an annotated drawing using black pen or pencil. You could include photos in addition if you took any, but a hand-made drawing is mandatory. An example for a forest stratification diagram is shown below. You are not doing an art degree, so a straightforward sketch is fine – no painting required! However, you need to provide a scale, ideally showing the tree height on the y-axis of the diagram. The x-axis should show the size of your sampling plot. Remember plants have scientific names and these, together with their vernacular equivalents, need to be included on your sketch and in the text of your report.
- Soil pH
You will establish the acidity/alkalinity of the soil using a pH meter to measure the soil pH. This measure will be repeated 10 times at different locations within each plot. Your demonstrator will show you how to use a pH meter, be careful the glass probes are delicate and expensive! Normally you dilute one part of soil with 9 parts of distilled water, mix it well and then carefully dip the probe into the solution until the reading is stable.
Remember, pH is recorded on a logarithmic scale. This means that it is incorrect to simply calculate a mean (average) for your pH data. For this report, we are happy for you to simply use your pH ranges (highest and lowest) as an appropriate summary statistic for your pH results. Anyone who wants to convert pH data into a hydrogen ion concentration (this is on a linear scale) in order to calculate the mean hydrogen ion concentration, and then convert the mean back into a pH value is welcome to do so – but this is not required. If you chose to do this additional calculation, then you should clearly highlight it in your report and provide statistics, testing for significant differences of the pH between the two plots. This would help to bring your report up from being ‘basically ok’ to ‘great’!
- Light intensity
A demonstrator will show you how to measure PAR (Photosynthetic Active Radiation, i.e. the amount of light available to a plant for photosynthesis). You are going to take ten measurements in each plot. Sampling points should be randomly distributed within the plot to guarantee a representative sample. The unit you are measuring is μ mol m-2 s-1. We want you to calculate the average light intensity for each plot and test for differences between the plot with Rhododendron and the plot without Rhododendron, using a Student’s t-test (if your data are normally distributed) or a Mann-Whitney U test (in case your data are not normally distributed). Your results should be presented in form of median and whisker box plots (if not normally distributed) or bar charts mean ± SE (if normally distributed), one for ‘Rhododendron’ and one for ‘no-Rhododendron’.
- Leaf litter depth
The leaf litter (humus) layer is that part of the soil that is not yet decomposed by microorganisms and other decomposers, therefore consisting mainly of rotting leaves and other dead plant matter like fruits, twigs, or seeds. Using a normal office ruler, you measure the depth of the leaf litter in each of the two plots ten times. Apply the scoop or spate to dig a small pit into the soil with a sharp vertical edge. The pit should be deep enough to reach the basement soil. Use the ruler to measure the height (depth) of the leaf litter layer in cm. Calculate the average leaf litter depth for each plot and test for differences between the plot with Rhododendron and the plot without Rhododendron, using a Student’s t-test (if your data are normally distributed) or a Mann-Whitney U test (in case your data are not normally distributed). Your results should be presented in form of median and whisker box plots (if not normally distributed) or bar charts mean ± SE (if normally distributed), one for ‘Rhododendron’ and one for ‘no-Rhododendron’.
- Leaf litter invertebrates
Scoop up a handful of leaf litter and place in a plastic tray. Count the number of invertebrates in the sample. Record both the different types (taxa) and the number of individuals for each taxon. For some very common small taxa you may have to estimate the numbers – how are you going to do this accurately? You will repeat this procedure 10 times for the Rhododendron plot and 10 times for the no-Rhododendron plot.
You will, hopefully, now be aware that when species are mentioned in a report that their scientific names need to be included. For this report, however, you are unlikely to be identifying invertebrates down to species level. A good get-out word is taxon (plural: taxa) – this just means a given level of classification which could be species, but could be a higher taxon such as genus, family, or order.
Although you will not be able to give scientific species names for all collected invertebrates, you must give the correct zoological name for the higher taxa identified (e.g. the scientific names for beetles is Coleoptera). Keep in mind: species and genus names must be italicized, while all higher taxa names are not! To identify the taxa in your samples you can use the provided Identification Guides. Moreover, there are numerous books in the University library that should assist you with scientific names for plants and invertebrate taxa. You do not need to apply any statistics to these data, but you should produce a bar chart (or table) showing the abundance of all taxa in both plots.
Writing the report
Please be aware that LJMU considers plagiarism a serious offence! Using the phrasing of other authors (including that of fellow students) is considered plagiarism and will be reported accordingly. To detect plagiarism, you need to submit your report first to Turnitin, a plagiarism check software (see specific column in Canvas Grades), before you submit the final report to the respective column in Canvas. Anything above 30% similarity to other documents will be considered plagiarism!
Report writing should follow the standard pattern for a University science write up which has already been discussed in the ‘Fundamentals’ module. Your results section should NOT contain any raw data (e.g. lists of all your pH values, lists of all your light readings, lists of raw count data for the invertebrates you found). Should you wish to include such things in your report (this is not necessary) they should go in an Appendix after your reference section. Instead, use summary statistics (means, medians, ranges etc.) as appropriate when presenting your data. The basic structure of your report should be as follows:
*Introduction
Introducing the topic of your report and summarising previous work on this topic. Here you should present literature relating to your study. At the end of the introduction, you need to present predictions regarding the expected outcomes of your measurements in Rhododendron and non-Rhododendron plots.
*Methods
Written in past tense, in paragraphs and it should be detailed enough that someone else could read it and repeat your study.
*Results
Including tables, graphs and statistics of processed data along with a written summary of your results.
*Discussion
Including comments about the nature conservation implications of Rhododendron based on your data and information from the literature. Reflect on your data, what could have been improved whilst sampling in the field, what did other researchers found? Do your results conform to their findings?
*References
REMEMBER, any reference in your reference list needs to be cited in the text of your report and vice versa.
*Appendix
Not required but you may consider it useful for some supplementary tables of your raw data.
Word-count guidance: The word limit is flexible, but a good report will generally be in the region of 1500-2000 words.
More detailed information on how to analyse the data and how to prepare the report will be provided during two Q&A lectures following the virtual field trip (see time table), during the L4 tutorials and as part of the Fundamentals of Scientific Research module (4201NATSCI).
Background information on Rhododendron
The Rhododendron species you were studying is Rhododendron ponticum. As explained in the introduction to these notes, Rhododendron is not native to the UK. The best short summaries on the history of Rhododendron introduction and the negative impact on UK forests and conservation areas is given in the Introductions of the following papers:
Dehnen-Schmutz, K., Perring, C. and Williamson, M. (2004) Controlling Rhododendron ponticum in the British Isles: an economic analysis Journal of Environmental Management 70, 323-332.
Cross, J.R. (1975) Rhododendron ponticum (Biological flora of the British Isles) Journal of Ecology 63, 345-364.
Sutton, C.A. and Wilkinson, D.M. (2007) The Effects of Rhododendron on testate amoebae communities in woodland soils in North West England. Acta Protozoologica 46: 333–338.
Peterken, G.F. (2001) Ecological effects of introduced tree species in Britain. Forest Ecology and Management 141: 31-42.
Of course, you need to find further references by yourself!